
Historical Geography Research >
The Location Distribution of National Capital Mechanized Flour Milling Industry in Modern China
Received date: 2024-05-17
Online published: 2025-05-20
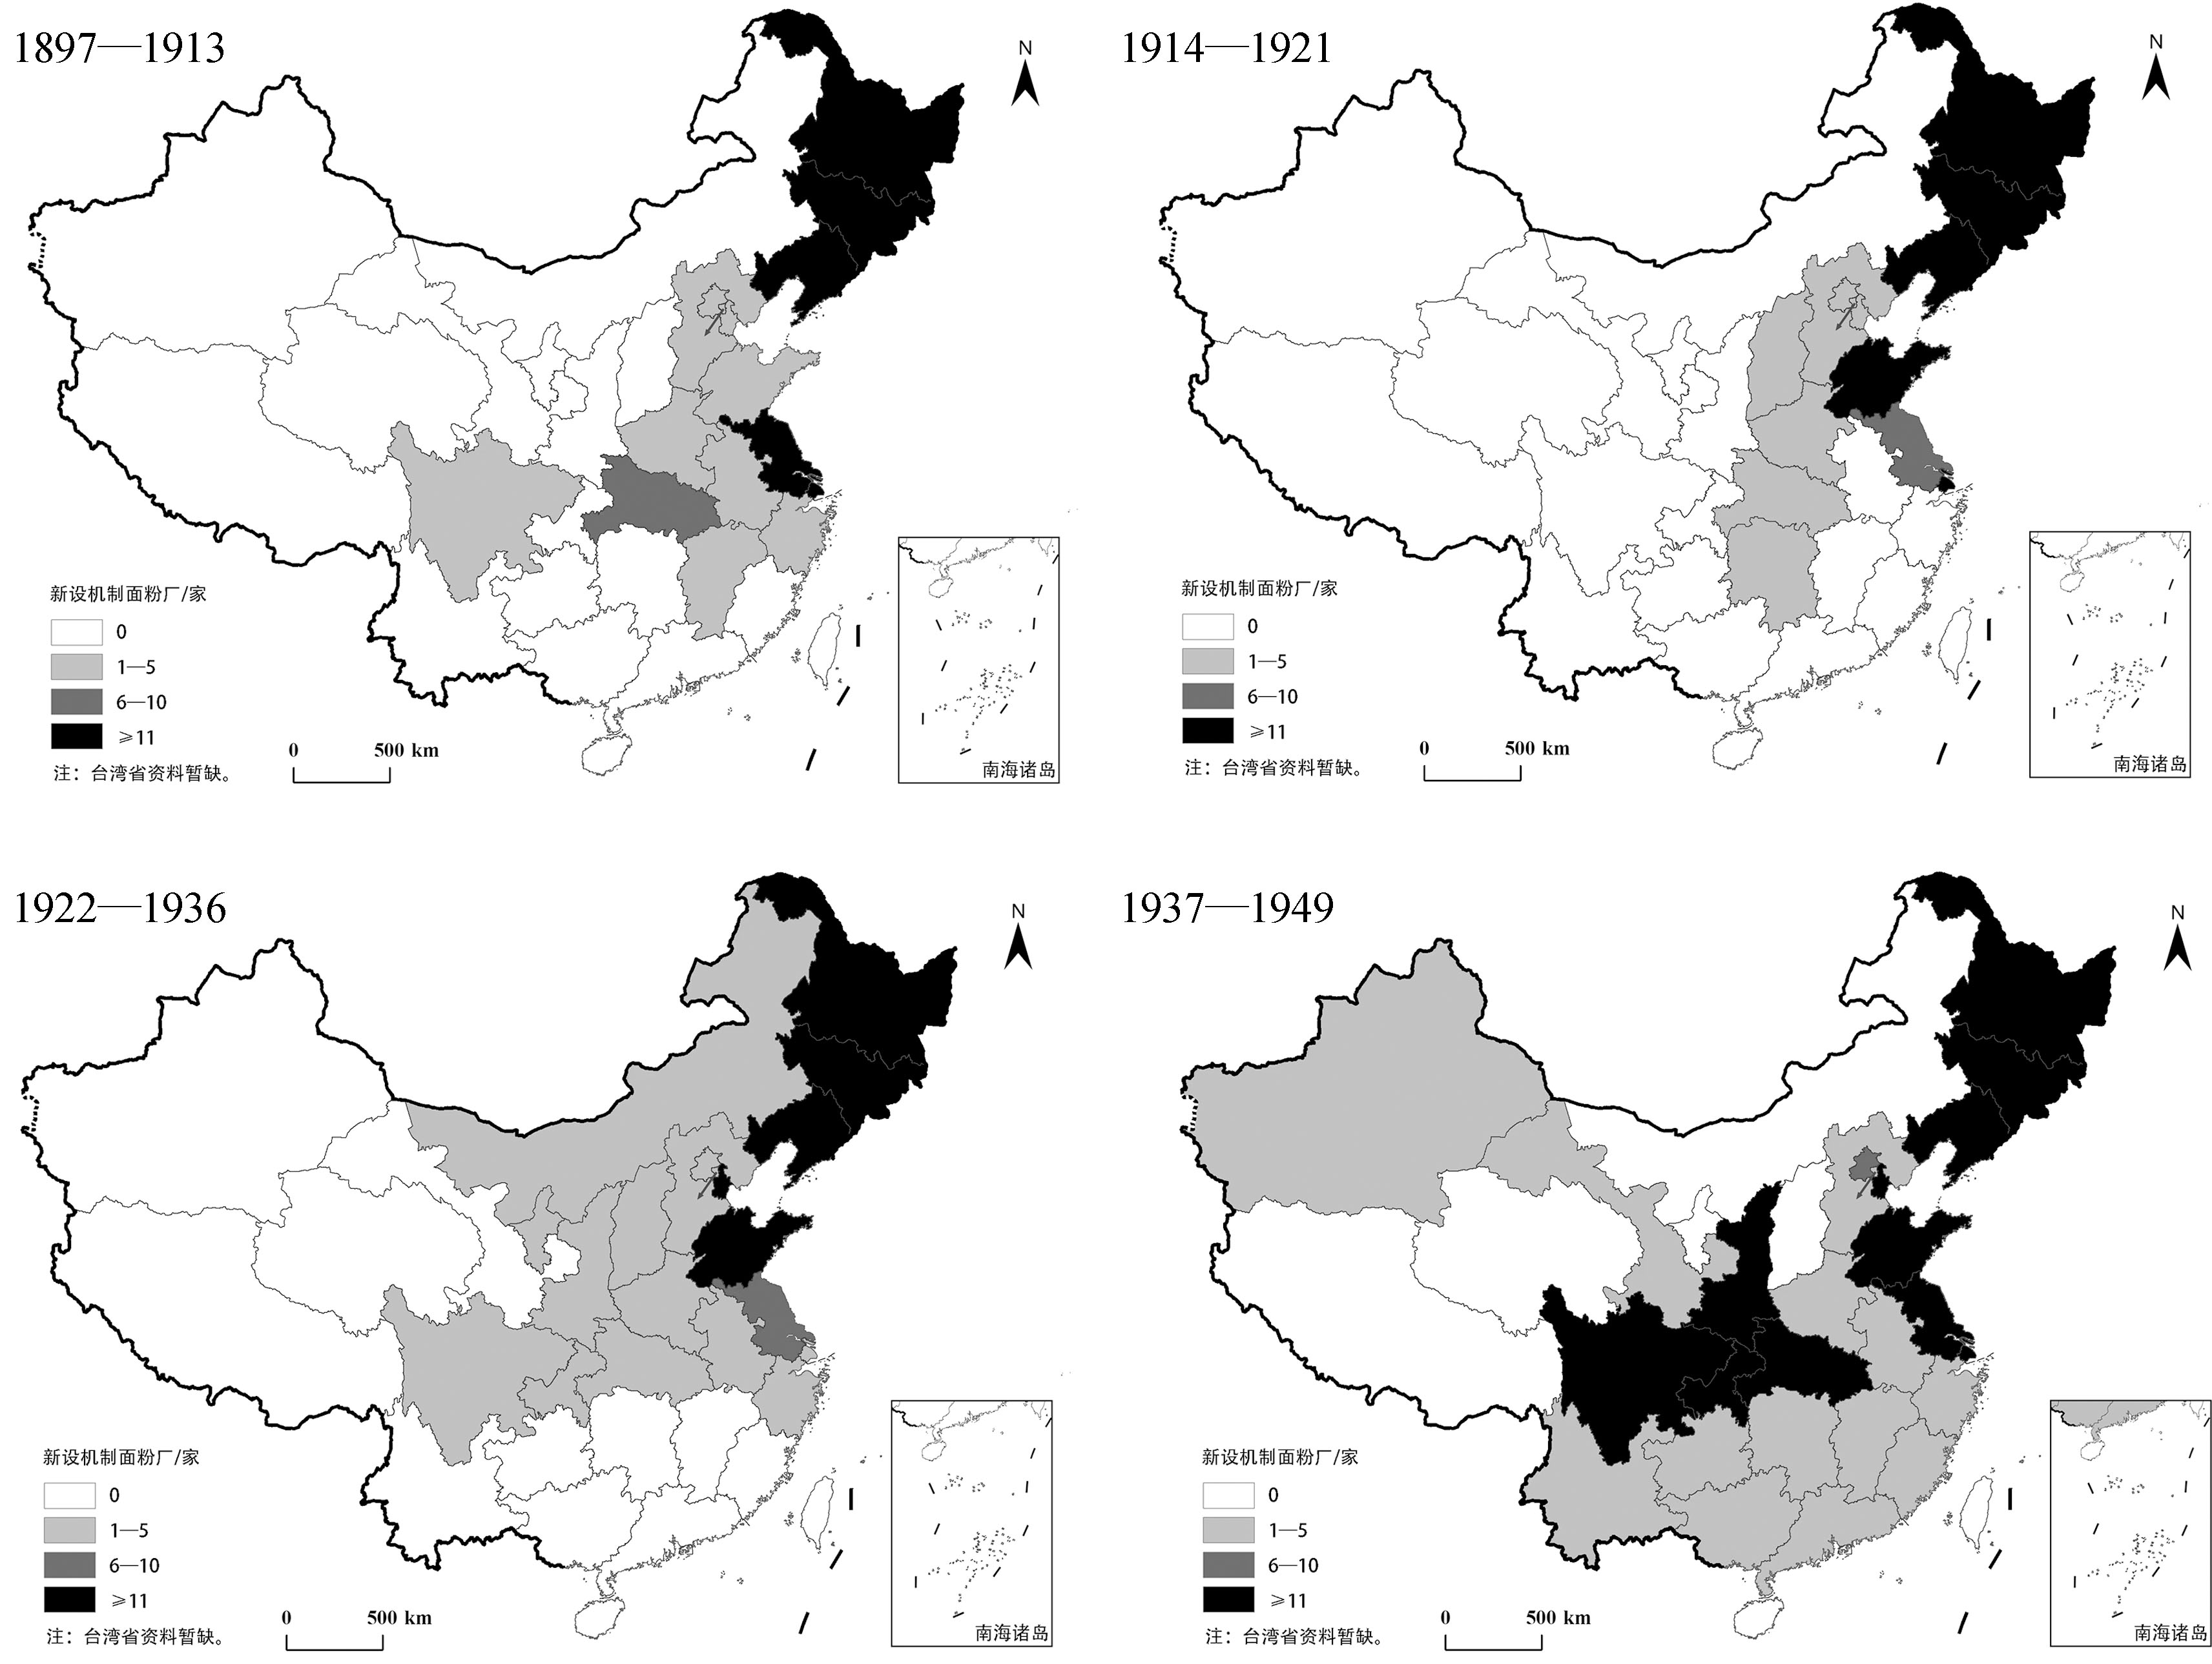
The development of modern China’s mechanized flour milling industry can be broadly divided into four stages, yet the development across different regions was highly uneven. The establishment and location selection of typical factories reveal that the site choices for mechanized flour milling were the result of a combination of natural resource endowment, regional economic and cultural environments, and the personal concepts of entrepreneurs. Unlike Western flour industries, which were largely influenced by natural factors, the location selection of modern China’s mechanized flour milling industry was more significantly affected by regional economic factors such as transportation, capital, and sales markets. The locational evolution of the national capital mechanized flour milling industry in modern China conforms to the ‘port-hinterland’ model, with industrial development levels exhibiting a gradient decrease from the coastal areas to the inland regions.
Wang Xiaopei , Yuan Weipeng . The Location Distribution of National Capital Mechanized Flour Milling Industry in Modern China[J]. Historical Geography Research, 2025 , 45(1) : 71 -87 . DOI: 10.20166/j.issn.2096-6822.L20240179
表1 近代各时期中外资本新设面粉厂数量及生产能力对比 |
| 时 段 | 民族资本 | 外国资本 | ||
|---|---|---|---|---|
| 新设厂数/家 | 生产能力/包 | 新设厂数/家 | 生产能力/包 | |
| 1897—1912 | 46④ | 38 057 | 43 | 85 440 |
| 1913—1921 | 105 | 203 585 | 18 | 43 169 |
| 1922—1936 | 122 | 193 515 | 14 | 45 550 |
| 1937—1949 | 270 | 142 652 | 23 | 38 650 |
资料来源: 数据来自中国科学院经济研究所等编《旧中国机制面粉工业统计资料》(科学出版社2018年版)表8《各时期民族资本新设面粉厂生产能力——按地区划分》、表9《各时期外国资本新设面粉厂生产能力——按地区划分》(第21、23页)。“生产能力”数字为各时期有日产量记载的各厂生产能力的合计数。另,根据上海市粮食局等编《中国近代面粉工业史》(第107页),每包面粉连袋重量为49磅,约合22.23千克,下同。 |
表2 1897—1949年各时段外资新设机制面粉厂数量统计(单位: 家) |
| 时 段 | 全国合计 | 东北地区 | 上 海 | 天 津 | 汉 口 | 济 南 | 其他省市 |
|---|---|---|---|---|---|---|---|
| 1897—1912 | 43 | 40 | 1 | 0 | 2 | 0 | 0 |
| 1913—1921 | 18 | 13 | 1 | 1 | 0 | 1 | 2 |
| 1922—1936 | 14 | 12 | 0 | 0 | 0 | 0 | 2 |
| 1937—1949 | 23 | 12 | 1 | 0 | 0 | 0 | 10 |
资料来源: 中国科学院经济研究所等编《旧中国机制面粉工业统计资料》表9《各时期外国资本新设面粉厂生产能力——按地区划分》(第23页),各阶段数据为分段相加所得,其中“东北地区”为原表“哈尔滨”与“东北各省市”数据之和。1937—1949年“其他省市”一栏主要指日本在山东青岛、河北保定和石门、山西大同、察哈尔和绥远等地设的面粉厂。 |
表3 1897—1949年各时段六大城市民族资本新设机制面粉厂数量统计(单位: 家) |
| 时 段 | 全 国 | 哈尔滨 | 上 海 | 天 津 | 汉 口 | 济 南 | 无 锡 |
|---|---|---|---|---|---|---|---|
| 1897—1913 | 59 | 5 | 11 | 1 | 5 | 1 | 5 |
| 1914—1921 | 92 | 24 | 15 | 3 | 4 | 8 | 5 |
| 1922—1936 | 122 | 8 | 4 | 14 | 3 | 4 | 2 |
| 1937—1949 | 270 | 0 | 36 | 17 | 62 | 0 | 12 |
资料来源: 各阶段数据为中国科学院经济研究所等编《旧中国机制面粉工业统计资料》表2《历年民族资本面粉厂新设厂数——按地区划分》(第11页)中各年各地区新设厂数量分段相加所得。 |
表4 1897—1949年六大城市及全国新设民族资本机制面粉厂日生产能力(单位: 包) |
| 全国 | 哈尔滨 | 上海 | 天津 | 武汉 | 济南 | 无锡 | 六市合计 | |
|---|---|---|---|---|---|---|---|---|
| 1897—1912 | 38 057 | 5 850 (15.4%) | 15 700 (41.2%) | 480 (1.3%) | 2 700 (7.1%) | — | 3 400 (8.9%) | 28 130 (73.9%) |
| 1913— 1921 | 203 585 | 37 430 (18.3%) | 55 600 (27.2%) | 13 540 (6.7%) | 8 100 (4.0%) | 22 200 (10.9%) | 12 500 (6.1%) | 149 370 (73.4%) |
| 1922— 1936 | 193 515 | 14 020 (7.2%) | 18 000 (9.3%) | 40 050 (20.7%) | 5 360 (2.8%) | 15 750 (8.1%) | 5 450 (2.8%) | 98 630 (51.0%) |
| 1937— 1949 | 142 652 | — | 38 254 (26.8%) | 6 460 (4.5%) | 12 680 (8.9%) | — | 25 470 (17.9%) | 82 864 (58.1%) |
资料来源: 数据来自中国社会科学院经济研究所等编《旧中国机制面粉工业统计资料》表8《各时期民族资本新设面粉厂生产能力——按地区划分》(第21页)中各阶段合并计算所得,“生产能力”各栏数字为各时期有日产量记载的各厂生产能力合计数,括号中为各地在各时期占全国生产能力的百分比。 |
表5 20世纪30年代各地机制面粉工业情况统计 |
| 地区 | 厂数/家 | 工人数/人 | 平均产值/元 | 人均产量/包 | 平均资本额/元 | 单位资本额产值/元 | 开工率 |
|---|---|---|---|---|---|---|---|
| 上海 | 12 | 2 112 | 5 734 000 | 17 923 | 507 417 | 11.32 | 85% |
| 无锡 | 4 | 472 | 2 653 250 | 10 060 | 257 250 | 10.31 | 54% |
| 济南 | 7 | 738 | 2 969 000 | 8 141 | 365 429 | 8.12 | 70% |
| 天津 | 5 | 503 | 3 823 800 | 11 734 | 700 000 | 5.46 | 68% |
| 青岛 | 2 | 92 | 1 375 000 | 11 446 | 262 500 | 5.24 | 80% |
| 汉口 | 2 | 347 | 2 292 500 | 6 098 | 825 000 | 2.78 | 50% |
资料来源: 表中原始数据来自中国科学院经济研究所等编《旧中国机制面粉工业统计资料》,其中通过厂数、产值、产量和资本额数据(表27《1934年面粉产量及产值估计——按地区划分》,第52页),求得平均产值和单位资本额产值(产值/资本额,表示投入单位资本额所能带来的产值);人均产量由工人数与产量数据(表95《1932年各地面粉工业工人人数》,第154页)计算得出;“开工率”指实际生产面粉量占可能生产量的百分比,数据来自表26《1933年面粉产量估计——按地区划分》(第51页),为1933年数值。 |
表6 1933年与1939年各地机制面粉厂年生产能力赫芬达尔指数 |
| 地 区 | 1933年 | 1939年 |
|---|---|---|
| 上海 | 63.92% | 62.6% |
| 汉口 | 58.4% | 67.1% |
| 天津 | 50.54% | 72.2% |
资料来源: 1933年数据由《中国面粉业的概观》(何赋彝,《前趋》1933年第1卷第1期,第10—17页)内容计算所得。上海使用阜丰、福新八厂数据,汉口使用裕隆、福新五厂数据,天津使用寿丰一厂、福星一厂数据;年产量=日产量×工作日天数(根据《中国近代面粉工业史》,面粉工厂的每年开工天数约为240天)。1939年数据来自中国社会科学院经济研究所等编《旧中国机制面粉工业统计资料》表29《上海市1938—1942年民族资本面粉厂产量及设备利用情况》、表34《武汉市1932—1937年民族资本面粉厂产销量》、表40《华北地区1939年各厂面粉产销量》(第54、58、62页),其中汉口一栏为1937年数据。上海使用阜丰、福新七厂数据,汉口使用福新、五丰数据,天津使用寿丰、福星数据。 |
/
| 〈 |
|
〉 |
